Details on how to do this task: Make data accessible
PIHM has been validated by the V-catchment. Here we prepared the input files for the V-catchment simulation. The V-catchment is benchmark example for the 2-D overland surface flow coupled with channel routing
"P. Di Giammarco et al., 1996". In the benchmark example, a rainfall event of 90-minute duration, 3e-6 m/s is applied on the V-catchment. The runoff at the outlet is usually compared for model validation. In this section, we shows how to use PIHM simulate the rainfall-runoff response of the V-catchment. PIHM uses triangular mesh to represent the domain. The grid resolution may vary. Here, we used 782 triangles ( the area ranges from 1534.9m
2 to 2379.5m
2, with an average of 2046.0m
2) to represent the domain
. The users need the following step to finish the V-catchment simulation:
1. Install PIHM at your computer.
2. Download input files of V-catchment at [1].
3. Run PIHM by the command "./pihm".
4. Plot the column 18 of "vcat.rivFlx1".
You will be able to see the runoff response as Figure 2.
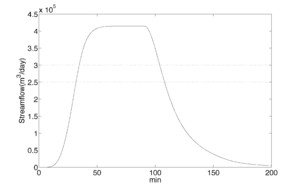
Figure 2: PIHM modeled hydrograph of the V-catchment
Another simulation is for a real watershed. Please find the details at
"Qu and Duffy, 2007". Here we demonstrate how to reproduce the simulation with PIHM2.2. The data is from the experiment in 1974, at Shale Hills, PA
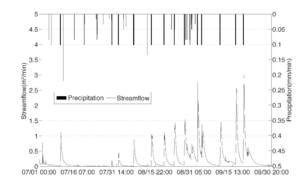
Figure 3: Rainfall runoff responses during the irrigation experiment in 1974.
.


