Legend: M Mandatory | States: ■ Not defined, ■ Valid, ■ Inconsistent with parent
Details on how to do this task: Make data accessible
PIHM has been validated by the V-catchment. Here we prepared the input files for the V-catchment simulation. The V-catchment is benchmark example for the 2-D overland surface flow coupled with channel routing
"P. Di Giammarco et al., 1996". In the benchmark example, a rainfall event of 90-minute duration, 3e-6 m/s is applied on the V-catchment. The runoff at the outlet is usually compared for model validation. In this section, we shows how to use PIHM simulate the rainfall-runoff response of the V-catchment. PIHM uses triangular mesh to represent the domain. The grid resolution may vary. Here, we used 782 triangles ( the area ranges from 1534.9m
2 to 2379.5m
2, with an average of 2046.0m
2) to represent the domain
. The users need the following step to finish the V-catchment simulation:
1. Install PIHM at your computer.
2. Download input files of V-catchment at [1].
3. Run PIHM by the command "./pihm".
4. Plot the column 18 of "vcat.rivFlx1".
You will be able to see the runoff response
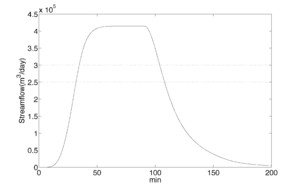
Figure 2: PIHM modeled hydrograph of the V-catchment
.
The data is from the experiment in 1974, at Shale Hills, PA
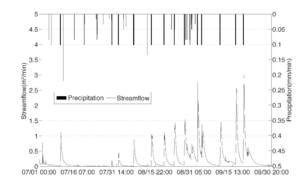
Figure 3: Rainfall runoff responses during the irrigation experiment in 1974.
.
Credits
Users who have contributed to this Task, its SubTasks and Answers:


